Color palette analysis becomes easier once you can describe why two green sweaters look different. One might be yellower, deeper or more vivid than the other. Each description answers a separate question and helps you use a seasonal chart even when the store calls both sweaters forest green. Start with the properties of the fabrics in front of you, then use them to read the palette as a whole.
Temperature describes the direction of a color
Most hue names cover a wide range. A red can look closer to orange or lean toward purple. A green can feel yellower like a new leaf or bluer like an evergreen in shadow. Compare two examples side by side before you decide which is warmer. A wine red may appear cool next to tomato red and warm next to a blue-based plum. The point of describing the comparison is to help you pick one of the colors you can actually use.
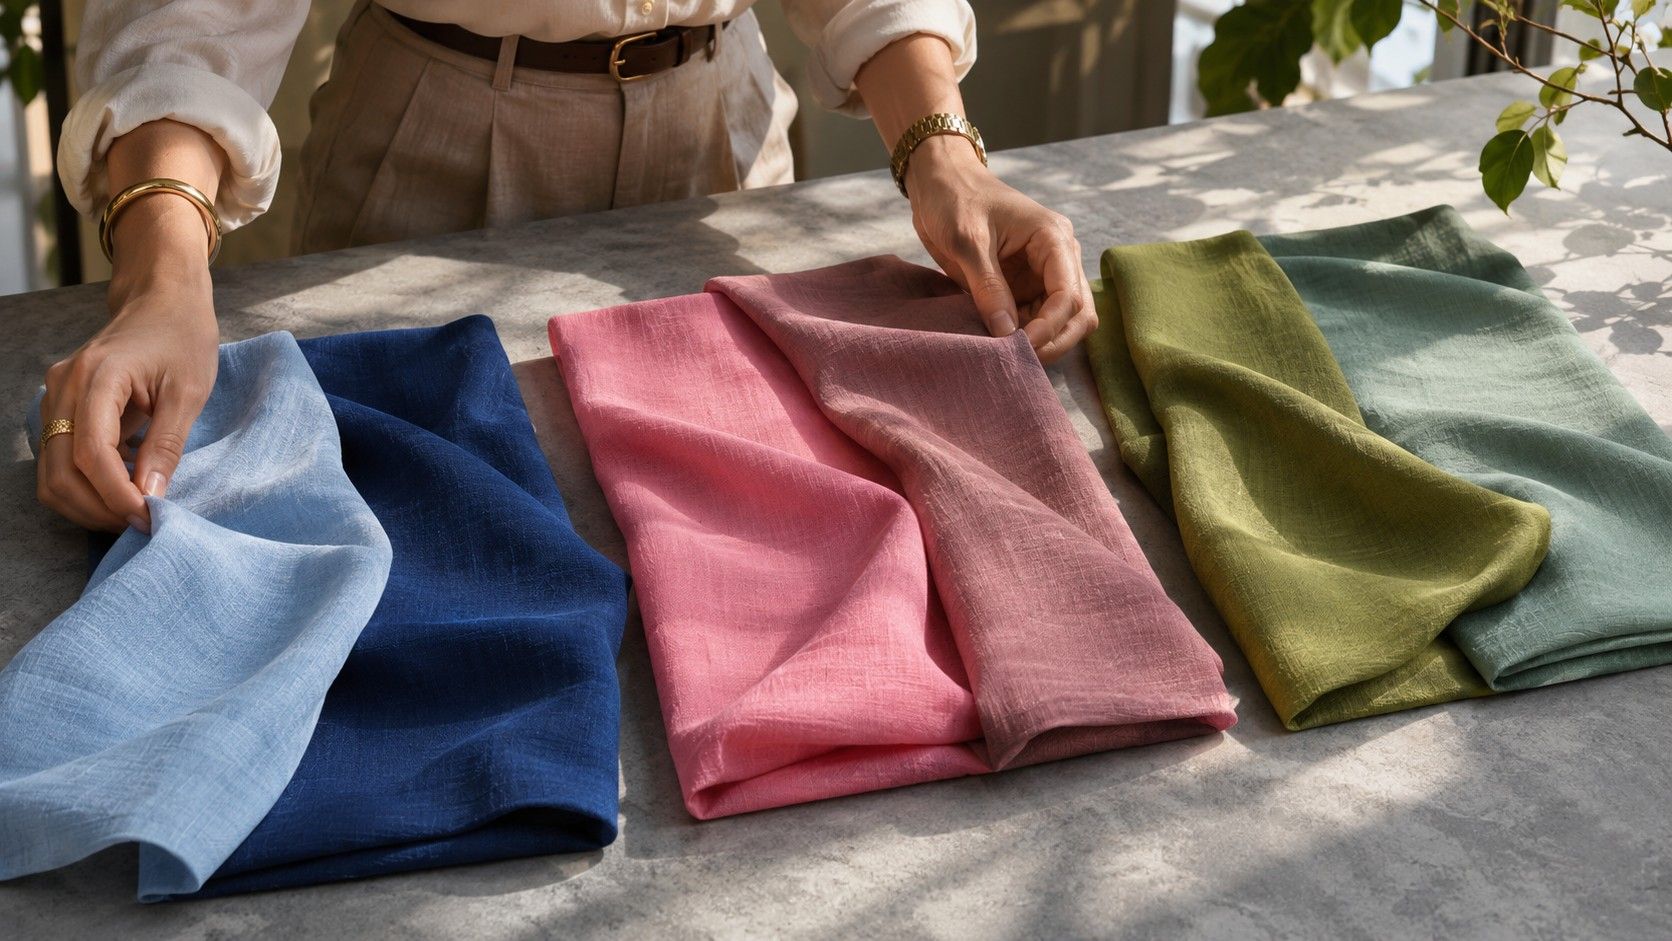
Beige is a good exercise because the differences are often small. Creamy linen, pinkish sand and gray-brown taupe can have similar depth. Place them against a neutral background to see which casts more yellow, pink or gray. Add a nearby white reference if you have one and check whether the difference lasts when you view the swatches under the light where you wear your clothes most often.
Apply warmth to a trustworthy sample of a color group. A chart labeled cool can still contain red, yellow or brown. The shade selected for the group often works with the neighboring colors because of its particular balance of hue, depth and chroma. Trying to divide all of the colors in your closet into two piles based only on their names will discard many useful options.
Depth is the light-to-dark range
The depth of a color tells you where it would fall between white and black. The term value refers to the same difference for this exercise. Think about light peach, medium terracotta and dark mahogany. The colors share a relationship with warm reds and oranges, but the difference between the first and last examples is visible from across a room.
Try arranging six swatches in order from lightest to deepest. Begin by placing the pieces that obviously belong at either end. Look at two middle pieces at a time and exchange them if necessary. A dark purple and rich green can be hard to sort at first because you are also seeing a difference in hue. A grayscale photo on your own phone can offer a second view as long as you keep the exposure fixed. Use the final daylight comparison to choose the garment you actually wear.
A palette chart usually has a range of depths even when it belongs to a season called Deep or Light. The chart may include a light neutral and a deep anchor to make outfits possible. Notice where the chart places the densest concentration of its colors and which of the deepest values it pairs with light shades. That pattern tells you more about a flexible wardrobe than the word Deep printed above the chart.
Chroma tells you how strongly the hue reads
Compare scarlet and a red with a gray or brown cast. The muted red can be just as dark as scarlet. Its chroma is lower because the red seems less intense. A similar difference shows up between clear blue and stormy blue or between bright grass green and soft sage. The label depends on the shade itself. Soft green can still look strongly colored when it sits beside a warm gray.
To see the effect, choose two fabrics you put in the same part of your depth range. Lay them together on a gray surface. Look away and back again. Which reads as a color from farther away? Which blends more readily with the background? Repeat with another family if you are judging highly different hues. An intense blue can catch your eye for different reasons from an equally intense yellow.
Keep fabric differences in mind while you sort. A sheer blouse can appear washed out on a pale hanger and richer over a darker layer. A heavy knit may appear lower in chroma when it contains fine threads of neighboring tones. Judge these garments after setting the backing or the layer you plan to wear. Your goal is a color that behaves as you expect in the outfit you use.
Read the chart by looking for a cluster
Start with a familiar shade from your own clothes. Find the chart swatch that fills a similar role and compare its temperature, depth and chroma. A season chart may place your familiar steel-blue sweater alongside muted raspberry and gray-green. Ask what properties the colors share. If all three are softened and cool, the chart suggests other color families where those properties may be easy to find.
Take a second comparison from a clearly different area of the chart. A light neutral works well after a middle-value accent. Many people can find overlap with one swatch in several seasons. A second match makes it easier to see whether the chart is describing the span of a wardrobe you would wear. If one of your known good colors sits outside the cluster, test it as part of an outfit and keep its role in your notes.
Seasonal names differ across charts. Compare swatches and written definitions when two sources use different names for the group you are exploring. A chart may emphasize muted colors or a certain range of depths even when a related chart uses a different label for a similar setting. Saving an actual example helps you recognize what you want the next time you shop.
Use your description to handle an uncertain color
Suppose you like a mulberry jacket but often wear cool muted tones. The jacket appears cooler and softer than a crimson one, although it is also much deeper than your regular blue-gray. Try a similarly deep shade you know you enjoy at the neckline. If the mulberry looks easy to wear in the same setting, it can be one of the darker pieces in a generally medium-depth palette. If the depth gives you trouble, try a lighter mulberry before changing hue.
Once you can describe a swatch in three parts, you can make smaller changes. Try a cooler version at the same value, or choose a softer version of the same hue. Keep a neutral alongside the color when possible so you can see the effect by itself and visualize an actual use. The colors you keep are the ones that serve your outfits. The chart supplies a vocabulary and nearby swatches to test.